7 Examples of an Analytical Report to Drive Growth in 2025
- Sep 15, 2025
- 17 min read
In a world drowning in data, a powerful analytical report is your lifeline. It’s not just about charts and graphs; it’s about translating complex information into clear, strategic actions. However, many businesses find themselves paying top dollar for bloated agency reports that are dense, confusing, and ultimately, useless. These reports often obscure the truth behind a wall of vanity metrics, failing to provide the actionable insights needed for real growth. They look impressive but don't move the needle.
This article cuts through that noise. We will dissect seven distinct examples of an analytical report, showcasing how a focused, expert approach delivers clarity and drives decisions. This is the core difference between an over-priced, impersonal agency and a specialized consultant who lives and breathes your data. A dedicated expert focuses on what matters: turning raw numbers into revenue-generating strategies.
By examining these real-world examples, you'll learn to spot the difference between a report designed to impress and one designed to perform. We will cover everything from market research and financial analysis to digital analytics and competitive intelligence. You will gain the tools to demand analysis that actually impacts your bottom line. Forget generic templates and surface-level observations. Let’s dive into what makes a report truly valuable and how to build one that fuels genuine business growth.
1. Market Research and Analysis Report
A Market Research and Analysis Report is a foundational example of an analytical report that serves as a strategic compass for a business. It synthesizes vast amounts of data about market conditions, consumer behavior, the competitive landscape, and emerging industry trends. The primary goal is to transform raw data, from both primary and secondary sources, into actionable intelligence that guides critical decisions like product development, market entry, and marketing campaign strategies.
This type of report doesn't just present numbers; it tells a story about where the market is and where it's going. By analyzing quantitative data (like market size and sales figures) alongside qualitative data (like consumer sentiment from focus groups), businesses can uncover hidden opportunities and anticipate potential threats before they materialize.
Strategic Breakdown and Application
Market analysis reports are crucial when a business needs to validate assumptions and reduce risk. For instance, a startup developing a new SaaS product would use this report to confirm market demand, identify key competitors, and pinpoint the ideal customer profile. Similarly, an established e-commerce brand could use it to explore expansion into a new geographic region, understanding local consumer preferences and regulatory hurdles.
The analysis hinges on a structured approach:
Competitive Landscape: Not just listing competitors, but analyzing their strengths, weaknesses, pricing models, and market share.
Consumer Segmentation: Grouping potential customers by demographics, psychographics, and behavior to tailor marketing messages.
Trend Analysis: Identifying macroeconomic, technological, and cultural shifts that could impact the industry.
Key Strategic Point: The real value of a market analysis report lies in its predictive power. Instead of just describing the current state, a strong report uses trend analysis and consumer data to forecast future market dynamics, giving a business a crucial first-mover advantage.
Actionable Takeaways for Your Business
A large, bloated agency might sell you an expensive, time-consuming market research project that delivers generic insights. As an individual Google Ads consultant, I apply these same analytical techniques on a focused, tactical scale. Instead of a 100-page report, we conduct targeted competitor and keyword analyses within the Google Ads ecosystem. This provides highly relevant, actionable intelligence without the six-figure price tag and agency overhead, allowing us to pivot strategies quickly based on real-time market behavior.
To create your own version of this essential analytical report, you can:
Use tools like Google Trends and SEMrush for competitive and keyword research.
Deploy customer surveys using platforms like SurveyMonkey to gather primary data.
Analyze industry reports from sources like IBISWorld or Statista for broader trends.
This focused approach delivers the core benefits of a market research report-clarity and direction-in a way that is agile, cost-effective, and directly tied to performance outcomes.
2. Financial Performance Analysis Report
A Financial Performance Analysis Report is an essential example of an analytical report that acts as a financial health check for an organization. It meticulously examines financial statements, key performance ratios, and cash flow data to evaluate profitability, liquidity, operational efficiency, and overall stability. The core purpose is to translate complex accounting figures into clear, strategic insights that inform investment decisions, operational adjustments, and long-term planning.
This type of report moves beyond just stating revenue or profit; it reveals the story behind the numbers. By analyzing data from the balance sheet, income statement, and cash flow statement, stakeholders can diagnose underlying issues and identify opportunities for growth. It answers critical questions like: Is the company generating enough cash to cover its debts? How efficiently is it using its assets to create profits?
Strategic Breakdown and Application
Financial performance reports are fundamental for both internal management and external investors. A CEO might use this analysis to pinpoint underperforming business units, while an investor, guided by principles from figures like Benjamin Graham, would use it to determine a company's intrinsic value before buying its stock. The analysis is built on a methodical evaluation:
Ratio Analysis: Calculating and interpreting ratios like the current ratio (liquidity), debt-to-equity ratio (leverage), and return on equity (profitability).
Trend Analysis: Comparing financial data over multiple periods (quarter-over-quarter or year-over-year) to identify patterns and growth trajectories.
Benchmarking: Measuring the company's performance against industry averages and direct competitors to provide crucial context.
Key Strategic Point: The true power of a financial analysis report is its ability to connect financial metrics to operational reality. A declining profit margin isn't just a number; it's a signal to investigate rising production costs, inefficient pricing strategies, or shifting market demand.
Actionable Takeaways for Your Business
While large corporations have teams dedicated to producing comprehensive reports, the principles are perfectly scalable. The problem with over-priced agencies is they often ignore the financial reality of your ad campaigns. Instead of a bloated agency that only reports on clicks and impressions, a specialized consultant focuses on the metrics that directly impact your bottom line, like Customer Acquisition Cost (CAC) and Return on Ad Spend (ROAS). This is a core part of learning how to measure advertising effectiveness. This lean, finance-first approach ensures every dollar is justified by the revenue it generates, providing the financial clarity you need without the hefty agency overhead.
To build your own focused financial analysis, you can:
Use accounting software like QuickBooks or Xero to generate standard financial statements.
Calculate key financial ratios to monitor liquidity, profitability, and efficiency.
Track campaign-specific metrics like ROAS within your advertising platforms to link marketing spend directly to revenue.
This approach provides the strategic financial oversight of a large-scale report but with the agility and cost-effectiveness that a dynamic business requires.
3. Customer Satisfaction and Experience Analysis Report
A Customer Satisfaction and Experience Analysis Report is a vital analytical tool that decodes the voice of the customer. It goes beyond simple ratings to dissect customer feedback, survey data, and behavioral metrics, providing a clear picture of satisfaction levels and pain points throughout the customer journey. The objective is to convert raw feedback into strategic initiatives that improve loyalty, reduce churn, and drive revenue.

This type of report synthesizes quantitative metrics like Net Promoter Score (NPS) and Customer Satisfaction (CSAT) scores with qualitative insights from open-ended feedback and support tickets. By analyzing this combined data, a business can identify the root causes of friction and pinpoint exactly where and why customers are struggling or succeeding.
Strategic Breakdown and Application
This report is indispensable for businesses focused on long-term, sustainable growth through customer retention. A SaaS company, for example, would use this analysis to identify features that cause user frustration, guiding their product development roadmap. Similarly, an e-commerce brand could analyze feedback to optimize its checkout process or improve post-purchase support, directly impacting repeat business.
The analysis breaks down complex customer sentiment into clear components:
Journey Mapping: Identifying specific touchpoints (e.g., onboarding, billing, support) that have the highest impact on overall satisfaction.
Sentiment Analysis: Using tools to classify qualitative feedback as positive, negative, or neutral to quantify overall feeling.
Root Cause Analysis: Digging into negative feedback to understand the "why" behind low scores, not just the "what."
Key Strategic Point: A powerful customer experience analysis connects satisfaction metrics directly to business outcomes. By tracking how changes in CSAT or NPS scores correlate with customer lifetime value and retention rates, you can prove the ROI of investing in a better customer experience.
Actionable Takeaways for Your Business
The key to this report is gathering meaningful data. To ensure your analysis provides genuine value, it's crucial to move beyond superficial data and focus on crafting an effective customer experience survey that yields actionable insights. As an independent consultant, I apply this customer-centric analysis directly to your Google Ads. Instead of just focusing on clicks, a specialized expert analyzes user behavior post-click. We look at landing page experience and connect campaign performance to downstream customer feedback. This uncovers insights a bloated agency with no individual specialization would miss, such as a high-converting keyword that consistently leads to dissatisfied customers and refund requests. This targeted analysis prevents wasted ad spend and improves overall customer quality.
You can create a focused version of this report by:
Deploying simple NPS or CSAT surveys after key interactions using tools like Delighted or Hotjar.
Regularly analyzing support ticket themes and chat logs for recurring issues.
Connecting Google Analytics behavioral data (like bounce rate on landing pages) with specific ad campaigns.
This agile approach provides a direct line to your customers' true experience, enabling you to make data-driven improvements that strengthen your business from the inside out.
4. Website and Digital Analytics Report
A Website and Digital Analytics Report is an essential example of an analytical report for any modern business. It translates raw data from digital platforms like Google Analytics, Adobe Analytics, or HubSpot into a clear narrative about website performance, user behavior, and marketing campaign effectiveness. The core purpose is to move beyond vanity metrics (like raw traffic) and focus on actionable insights that drive conversions, enhance user experience, and maximize return on investment (ROI).

This report dissects user journeys, from the initial click on an ad to the final conversion, to identify friction points and optimization opportunities. By analyzing metrics like bounce rate, session duration, and conversion funnel drop-offs, a business can pinpoint precisely where and why potential customers are leaving, allowing for targeted improvements to website design and marketing messaging.
Strategic Breakdown and Application
Digital analytics reports are the bedrock of performance marketing. A B2B company might use this report to discover that a specific blog post is a major source of high-quality leads, prompting them to create more content on that topic. An e-commerce store could analyze user flow to find that customers abandon their carts at the shipping page, indicating a need to simplify the process or offer better shipping options.
The analysis provides clarity through a structured review:
Traffic Source Analysis: Identifying which channels (Organic Search, Paid Search, Social Media) deliver not just traffic, but a high quality of traffic that converts.
User Behavior Flow: Visually mapping the paths users take through the site to understand engagement patterns and identify pages that cause exits.
Conversion Rate Optimization (CRO): Analyzing goal completions and funnels to find the biggest opportunities for increasing leads or sales.
Key Strategic Point: An effective digital analytics report doesn't just present data; it connects specific digital activities to bottom-line business outcomes. The ultimate goal is to understand the "why" behind the numbers, such as why one ad campaign generated a 5% conversion rate while another only managed 1%.
Actionable Takeaways for Your Business
Large, bloated agencies often deliver generic, automated analytics reports that are difficult to understand and even harder to act upon. They present dashboards filled with data but offer little in the way of specialized strategic guidance. This is where a focused, expert approach provides a distinct advantage. As a specialized Google Ads consultant, I skip the fluff and build custom reports that directly address your business goals. We don't just look at clicks; we analyze the entire conversion path to ensure every dollar of your ad spend is working efficiently. You get direct expertise without paying for agency overhead. For a deeper dive, you can explore paid search analytics strategies that can help you outsmart your agency.
To build your own powerful digital analytics report, focus on:
Setting up specific conversion goals in Google Analytics to track what matters.
Using UTM parameters on all campaigns to precisely measure traffic source performance.
Creating custom segments to analyze the behavior of your most valuable customer groups.
This video from Google provides a foundational understanding of how to get started:
This hands-on approach ensures your analysis is directly tied to improving performance and achieving tangible business growth.
5. Employee Engagement and HR Analytics Report
An Employee Engagement and HR Analytics Report is an internal analytical report that acts as a barometer for organizational health. It moves beyond simple headcount numbers to measure the morale, motivation, and satisfaction of a company's workforce. The primary goal is to transform survey responses, performance data, and HR metrics into clear insights that can improve retention, boost productivity, and foster a healthier workplace culture.
This type of report translates abstract concepts like "company culture" and "employee satisfaction" into tangible data points. By correlating quantitative metrics (like attrition rates and absenteeism) with qualitative feedback (from anonymous surveys), organizations can diagnose underlying issues and proactively address them before they impact the bottom line.
Strategic Breakdown and Application
HR analytics reports are vital for understanding the "why" behind workforce trends. For example, a tech company experiencing high turnover in its engineering department could use this report to discover that a lack of professional development opportunities, not compensation, is the primary driver. Similarly, a retail business can segment engagement data by store location to identify which managers are most effective at fostering positive team environments.
The analysis is built on a multi-faceted approach:
Sentiment Analysis: Using text analytics on open-ended survey questions to gauge the overall mood and identify recurring themes or concerns.
Driver Analysis: Identifying the key factors (e.g., management, work-life balance, recognition) that have the strongest statistical correlation with high engagement scores.
Performance Correlation: Linking engagement metrics directly to business outcomes, such as sales figures, customer satisfaction scores (CSAT), or production efficiency.
Key Strategic Point: The most powerful HR analytics reports connect employee sentiment directly to business performance. When you can demonstrate that a 10% increase in team engagement leads to a 5% decrease in customer churn, HR transitions from a cost center to a strategic growth driver.
Actionable Takeaways for Your Business
While large enterprises rely on sophisticated platforms, small and medium-sized businesses can adopt these principles effectively. As an independent Google Ads consultant, the success of my client campaigns is directly tied to my own focus and engagement, which I measure through client retention and performance KPIs. This mirrors the corporate environment: a disengaged agency team without individual specialization cannot deliver A-level results. Instead of a costly, complex annual survey that a large, bloated agency might use, you can implement a more agile approach.
To create your own version of this powerful analytical report, you can:
Use tools like Google Forms or Typeform for simple, anonymous pulse surveys.
Track key metrics like voluntary turnover rate and absenteeism in a simple spreadsheet.
Conduct regular, informal "stay interviews" to gather qualitative feedback before it becomes an "exit interview."
This lean methodology provides the essential insights needed to improve culture and retention without the overhead of enterprise-level HR software, ensuring your team remains a competitive advantage.
6. Competitive Intelligence and Industry Analysis Report
A Competitive Intelligence and Industry Analysis Report is a strategic deep dive into the forces shaping your business environment. This analytical report moves beyond simple competitor tracking to systematically examine rivals' strategies, market positioning, strengths, and weaknesses. The primary goal is to provide a clear, evidence-based understanding of the competitive landscape, empowering leadership to make informed decisions on product positioning, market entry, and long-term strategy.
This report synthesizes data from multiple sources to create a holistic view of the industry. It's not just a list of competitors; it's an analysis of their behavior, intentions, and capabilities. By dissecting everything from a competitor’s ad copy to their supply chain efficiencies, a business can anticipate market shifts, identify vulnerabilities, and uncover opportunities for strategic differentiation.
Strategic Breakdown and Application
This type of report is indispensable when the stakes are high, such as launching a new service, entering a competitive market, or defending market share. For example, a healthcare practice would use this analysis to understand how competing clinics are marketing their services, what their patient reviews say, and where service gaps exist. This intelligence directly informs their own marketing strategy and patient experience improvements.
The analysis is built on a methodical framework:
Competitor Profiling: Creating detailed profiles of key competitors, including their product offerings, pricing structures, marketing channels, and customer bases.
Industry Dynamics: Using frameworks like Porter’s Five Forces to analyze the bargaining power of buyers and suppliers, the threat of new entrants and substitutes, and the intensity of rivalry.
SWOT Analysis: Assessing each major competitor's Strengths, Weaknesses, Opportunities, and Threats to pinpoint strategic advantages and vulnerabilities.
Key Strategic Point: The power of a competitive intelligence report is its ability to turn external market data into an internal strategic advantage. It’s about understanding the 'why' behind a competitor's actions, allowing you to proactively shape your own strategy rather than just reactively responding to theirs.
Actionable Takeaways for Your Business
While comprehensive industry reports from large firms are valuable, they often come with a significant price tag and a slow turnaround that's impractical for most businesses. As a specialized Google Ads consultant, I deliver the core value of competitive intelligence in a more agile, cost-effective, and directly applicable manner. Instead of a 100-page document that an over-priced agency might produce, we focus on a hyper-relevant analysis of the paid search landscape. We use specialized PPC competitor analysis tools to dissect rivals' ad spend, keywords, and landing page strategies in near real-time.
This concept map visualizes the logical flow from high-level profiling to strategic positioning, a core process in competitive analysis.
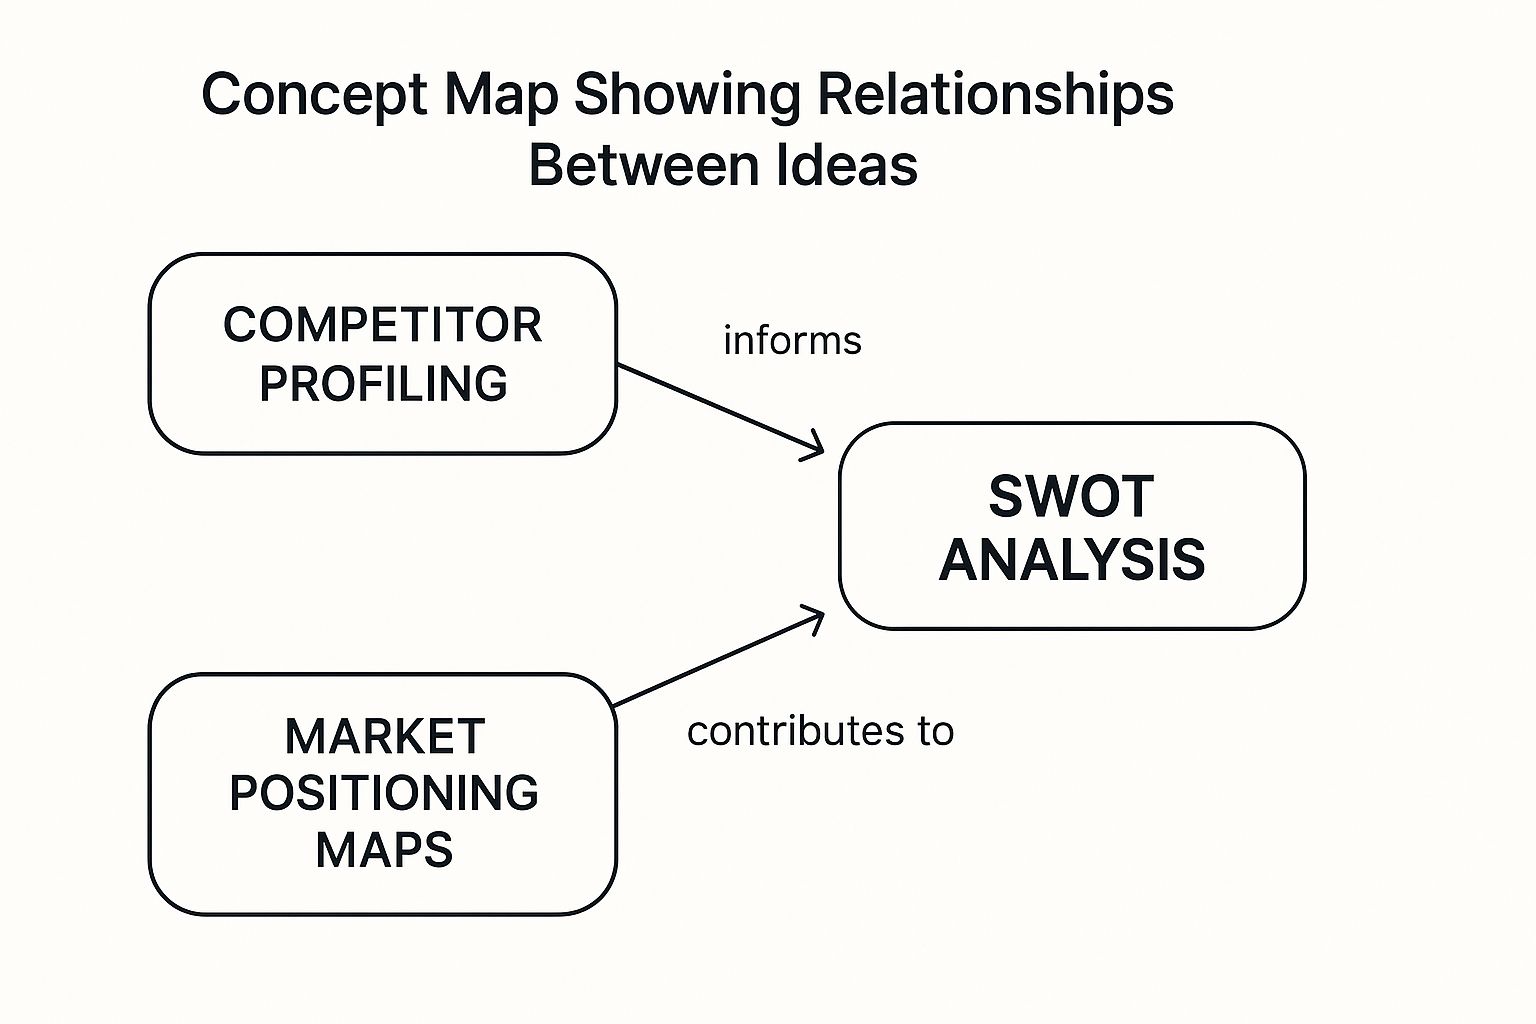
The visualization shows that effective competitor profiling provides the raw data needed for a robust SWOT analysis, which in turn informs where a business can strategically position itself on the market map.
To build your own focused competitive intelligence report, you can:
Leverage tools like SEMrush or SpyFu to analyze competitors’ digital advertising footprints.
Set up Google Alerts for key competitors to monitor their announcements and media mentions.
Regularly review competitor customer reviews on platforms like G2, Capterra, or Google My Business.
This nimble approach avoids the bloat and overhead of large agencies, providing actionable intelligence that can be immediately used to optimize campaigns and outmaneuver the competition.
7. Risk Assessment and Management Analysis Report
A Risk Assessment and Management Analysis Report is a critical example of an analytical report designed to systematically identify, evaluate, and prioritize potential threats to an organization. It examines risks across operational, financial, strategic, and compliance dimensions, providing a structured framework for mitigation, contingency planning, and confident decision-making in the face of uncertainty. The core function is to transform abstract threats into a manageable, prioritized list with clear action plans.
This type of report is not just a defensive document; it is a strategic tool for building resilience. By quantifying the likelihood and potential impact of various risks, such as a cybersecurity breach, supply chain disruption, or regulatory change, businesses can allocate resources effectively. It moves an organization from a reactive state of crisis management to a proactive one of risk-informed strategy, ensuring long-term stability and growth.
Strategic Breakdown and Application
Risk assessment reports are indispensable when an organization needs to protect its assets, reputation, and operational continuity. For example, a financial institution uses stress test reports to understand its vulnerability to economic downturns, as required by regulators. Similarly, a tech company would commission a cybersecurity risk assessment from a firm like Deloitte to identify weak points in its infrastructure before they can be exploited by malicious actors.
The analysis is built on a methodical framework:
Risk Identification: Brainstorming and listing all potential risks, from internal process failures to external market shifts.
Risk Evaluation: Analyzing each risk for its probability of occurrence and the severity of its potential impact (often using a heat map).
Prioritization: Ranking risks to focus attention on the most critical threats that exceed the organization's defined risk appetite.
Key Strategic Point: An effective risk management report doesn't aim to eliminate all risk, which is impossible. Instead, its strategic value comes from creating a clear, actionable roadmap for mitigation, transferring, accepting, or avoiding specific risks based on a cost-benefit analysis.
Actionable Takeaways for Your Business
While large corporations develop extensive risk frameworks, the underlying principles are vital for businesses of any size. As a specialized Google Ads consultant, I apply a focused version of this risk analysis to my clients' advertising accounts. Instead of a complex corporate-wide assessment, we analyze risks specific to their campaigns: a sudden spike in cost-per-click, a competitor's aggressive new strategy, or an unexpected Google algorithm update. This micro-level risk report is far more agile and useful than a generic, high-level analysis from a large agency without individual specialization. We identify the top threats to campaign profitability and develop clear, pre-planned responses.
To create your own targeted risk analysis, you can:
Use a simple risk matrix to plot the likelihood and impact of potential issues.
Monitor competitor bidding patterns and ad copy changes using tools like SEMrush.
Develop a "contingency budget" for ad spend to test new strategies if a primary campaign falters.
This approach delivers the core benefit of a risk assessment report, resilience, in a manner that is fast, cost-effective, and directly linked to protecting your marketing investment and performance.
Comparison of 7 Analytical Report Types
Report Type | Implementation Complexity 🔄 | Resource Requirements 🔄 | Expected Outcomes 📊 | Ideal Use Cases 💡 | Key Advantages ⭐ |
|---|---|---|---|---|---|
Market Research and Analysis Report | High - involves extensive data collection and analysis | High - requires access to varied quantitative and qualitative data | In-depth market insights, opportunity identification, competitive benchmarking | Product launches, market entry, investment decisions | Data-driven strategic planning, risk reduction, opportunity discovery |
Financial Performance Analysis Report | Medium - requires financial expertise and data synthesis | Medium - access to financial statements and accounting data | Objective financial health assessment, trend identification | Investment evaluation, lending decisions, operational improvements | Supports informed investment decisions, peer benchmarking |
Customer Satisfaction and Experience Report | Medium - continuous feedback collection and analysis | Medium - survey tools, behavioral and sentiment data | Identification of customer pain points and satisfaction trends | Customer retention, service improvement, CX optimization | Actionable insights for reducing churn, improving experience |
Website and Digital Analytics Report | Medium to high - requires technical setup and data interpretation | Medium to high - web analytics tools and digital marketing data | Real-time digital performance insights, conversion optimization | Digital marketing strategy, UX improvement, ROI tracking | Enables data-driven optimization, tracks campaign ROI |
Employee Engagement and HR Analytics Report | Medium - combines surveys and HR metrics analysis | Medium - requires internal HR data and survey tools | Understanding of employee satisfaction, turnover causes | Employee retention, productivity improvement, HR policy formation | Identifies satisfaction drivers, reduces turnover costs |
Competitive Intelligence and Industry Analysis | High - involves systematic competitor data gathering and analysis | High - access to diverse market and competitor information | Strategic insights for competitive positioning and market entry | Strategic planning, competitor benchmarking, market gap analysis | Enables anticipation of competitor moves, strategic advantage |
Risk Assessment and Management Analysis Report | High - requires multidisciplinary risk evaluation and expert judgment | High - needs comprehensive risk data and stakeholder involvement | Proactive risk identification, mitigation planning, compliance | Enterprise risk management, crisis preparedness, regulatory compliance | Supports decision-making under uncertainty, ensures compliance |
From Data Overload to Decisive Action: Why Your Reporting Partner Matters
Throughout this guide, we've dissected seven distinct examples of an analytical report, moving far beyond surface-level descriptions to uncover the strategic frameworks that transform raw data into a competitive advantage. From financial performance and customer satisfaction to website analytics and competitive intelligence, a clear pattern emerges. The most powerful reports are not simply collections of charts and figures; they are focused narratives that answer critical business questions and illuminate the path forward.
We've seen how a well-structured market research report can validate a new product launch and how a meticulous website analytics report can pinpoint the exact friction points costing you conversions. Each example underscores a universal truth: the value is not in the data itself, but in the expert interpretation, the strategic insights drawn from it, and the actionable recommendations that follow. A report that merely states "website traffic is down 15%" is an observation. A report that diagnoses the cause, quantifies the impact on revenue, and provides a clear, prioritized list of solutions is a catalyst for growth.
The Agency Bloat vs. The Expert Advantage
This is where a crucial distinction comes into play, especially for businesses leveraging complex platforms like Google Ads. Many business owners and marketing managers find themselves trapped in a cycle of receiving dense, confusing reports from large, bloated agencies. These reports are often generated from standardized templates, lacking the specific context of your unique business goals, industry nuances, and competitive landscape. You pay a premium for overhead, layers of account managers, and a generic approach that leaves you with more questions than answers.
In stark contrast, partnering with a specialized, individual consultant provides a fundamentally different experience. The focus shifts from boilerplate data delivery to a collaborative, goal-oriented partnership. A dedicated expert is not just running your campaigns; they are deeply invested in your success. This direct relationship eliminates the communication gaps and diluted focus common in larger agency structures where individual specialization is rare.
Strategic Insight: The goal of an analytical report isn't to impress you with complexity; it's to provide you with clarity. A true expert translates complex data streams into a simple, compelling story about what's working, what isn't, and precisely what to do next to achieve your objectives.
Key Takeaways for Actionable Reporting
As you move to implement these principles in your own business, remember these core takeaways from the examples of an analytical report we've explored:
Context is King: Always frame your data within the larger context of your business goals. A metric is meaningless without a clear "so what?" attached to it.
Prioritize Actionability: Every insight should be paired with a concrete, prioritized recommendation. This transforms the report from a passive document into an active strategic tool.
Narrative Over Numbers: Structure your report to tell a story. Begin with the high-level summary, drill down into the supporting evidence (the "why"), and conclude with a clear call to action for the next steps.
Demand Deeper Insights: Don't settle for reports from over-priced agencies that just skim the surface. The most valuable analysis lives in the second and third layers of data, connecting disparate points to reveal hidden trends and opportunities.
Ultimately, mastering the art of the analytical report is about shifting from a reactive to a proactive stance. It’s about making informed, data-driven decisions that consistently move the needle on what matters most to your business, whether that's increasing lead quality, boosting e-commerce sales, or maximizing your return on ad spend.
Tired of generic agency reports that fail to deliver a clear strategy for your Google Ads? As a dedicated Google Ads specialist, Come Together Media LLC provides the expert, in-depth analytical reporting needed to turn your ad spend into predictable, scalable growth. Schedule your free consultation today and see the difference a true partner can make.








Comments